Education Activities To Accompany Chandra Data Analysis Software
Cen X-3 & Clocks in the Sky
The Power Spectrum: how to find an accurate period of variation
Ideally, of course, we would like to analyze ALL of the data for this source at once. In order to find the most accurate period possible that represents all of the data in the observation, we use a technique called a power spectrum analysis. A power spectrum analysis determines what period or periods best fit the entire data set.
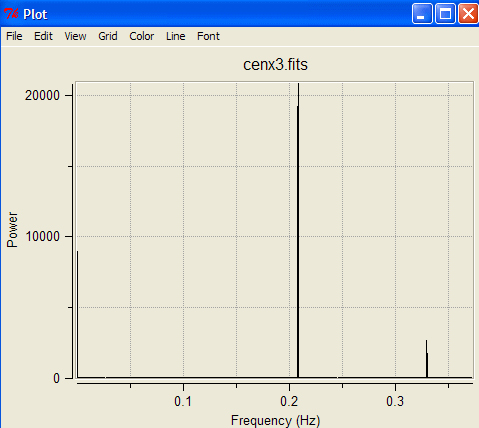
Go to the Analysis menu and click on FTOOLS/Power Spectrum. Click OK in the pop-up box that appears. After a short time, the power spectrum will appear. It will look like the figure below.
The power spectrum plots the likelihood that a frequencey is present in the data (represented by "power" on the vertical axis) as a function of frequency (on the horizontal axis). Notice that the plot consists of what appears to be a few sharp spikes, indicating that only a few frequencies (or periods) are present in the data. The tallest spike is at about 0.2 Hz. This means that the most likely frequency (reciprocal of period) in the light variation is 0.2 cycles per second. This corresponds to 1 cycle or period about every 5 seconds. This matches the period we estimated by looking at the data by eye above.
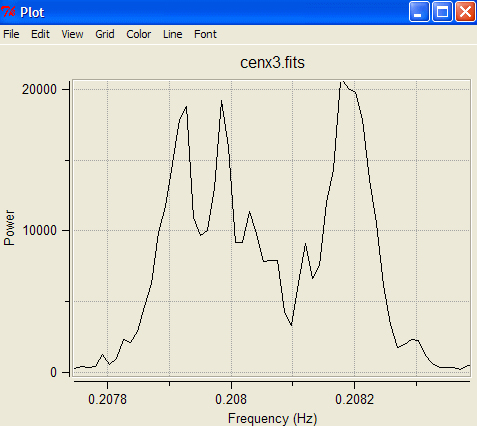
Now zoom in (using the same click-and-drag technique described above) on the tallest peak in the power spectrum, until you get a plot that spreads the spike across most of the graph. Your new power spectrum plot should look like the figure below.
The power spectrum now shows frequencies ranging from about .20783 Hz to about .2083 Hz. This is equivalent to a period range from about 4.812 s to about 4.801 s.
But why is it that frequencies covering a range are present in the data? Why isn't there just one frequency (or period) present?
|