 |  | |||||
| Learning ds9: Overview | Part 1 | Part 2 | Part 3 | [Contact Help] [Chandra Public Page] |
| |||||||||
| |||||||||
Learning to Use the ds9 Imaging SystemPart 2: More Features for Qualitative AnalysisTo use the features described in this section, first load the Cas-A image.This is the same Cas A data set that you used in the previous section, Learning ds9, part 1. The image can also be loaded through the Activities and Images section. If the image does not load, check to make sure that you have:
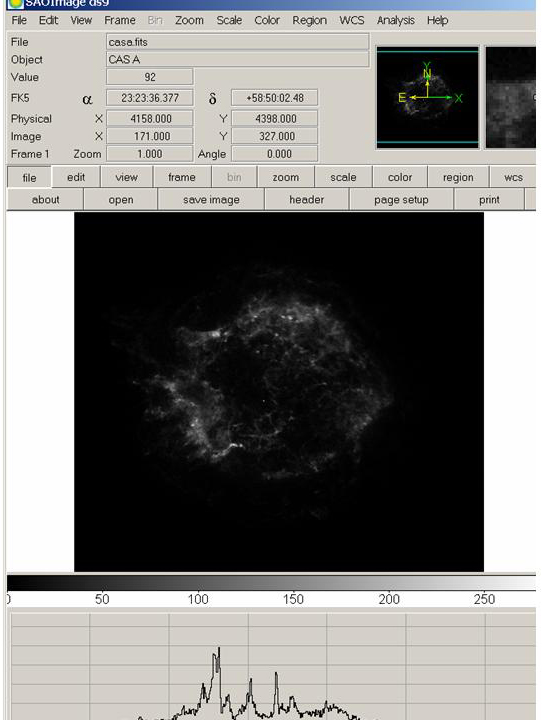
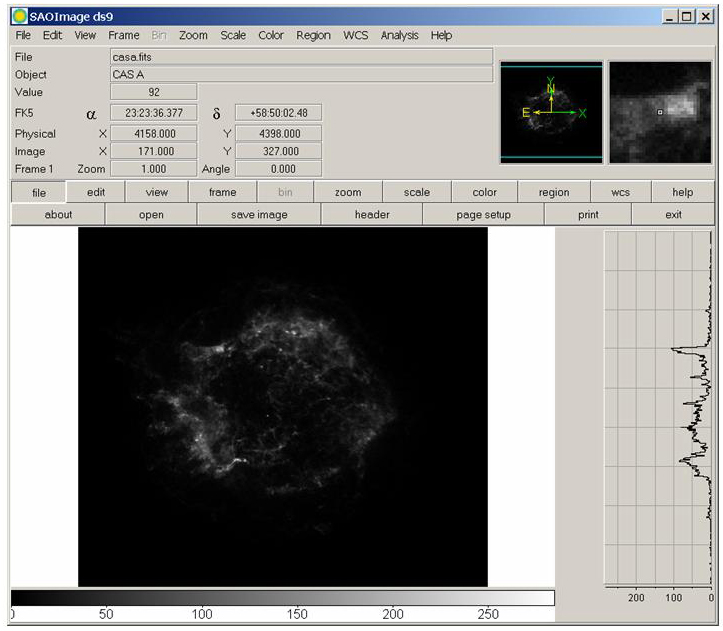
If you think you missed a step, go back to the top installation page and check to see that you have performed all of steps a, b and c. If you are still having a problem, contact SAO R&D. You will want to follow the directions in this section while working primarily in the ds9 window. We suggest that you print this section and use the printout as your reference for working in the ds9 window. Horizontal and vertical cuts Click on the 'view' menu near the top of the DS9 window, and click on 'Horizontal graph'. A new window will be displayed at the bottom of the image display. Now move the mouse up and down in the image window. Notice how the graph changes. This graph displays the values in the horizontal line of pixels going through the y position indicated by the pointer of the mouse. Look for peaks in the graph to get a qualitative feel for how the data varies over the x-axis of the image. Similarly, the vertical cut graph shows the data values in a vertical line of pixels as they vary over the y-axis of the image. When both of them are activated simultaneously, the shapes of features become easier to see.
To remove the graphs, pull down the analysis menu and click to deselect the items. Pixel value table Pull down the analysis menu and click on the pixel table. A new window will be activated that displays pixel values in a 5x5 pixel area around the mouse position. Now move the mouse around the image window. Notice how the pixel table display changes. This pixel table gives a small scale view of the data. It is especially useful when used in conjunction with the magnification window in the upper right corner (which shows a blown up version of the data under the current mouse position). To remove the pixel value table, close the window using the button in the upper left corner. Next: Display contours, Display coordinate grid & Summary Last updated: 08/26/08 |
|
Chandra Ed. Home Page | Installation | Learning ds9 | Activities & Images | Evaluation Learning ds9: Overview | part 1 | part 2 | part 3 Resources: ds9 | Chanda Public Information & Education |
|
|
Harvard-Smithsonian Center for Astrophysics 60 Garden Street, Cambridge, MA 02138 USA Phone: 617.496.7941 Fax: 617.495.7356 |
Comments & Questions? cxcedu@cfa.harvard.edu |
|
This site was developed with funding from NASA under Contract NAS8-39073. | |