Chandra EducationChandra Education
Chandra Education Home PageInstallation PageLearning ds9 PageImages & Activities PageEvaluation Page
Learning ds9: Overview | Part 1 | Part 2 | Part 3[Contact Help] [Chandra Public Page]
o


Part 3 Section Contents
Part 3: First Look at Quantitative Analysis

Learning to Use the ds9 Imaging System

Part 3: First Look at Quantitative Analysis using ds9

Introduction

Having looked at Cas-A in a qualitative way, we now want to begin to focus on more quantitative study. In general, we investigate X-ray emitting objects such as Cas-A by studying the positions, energies or arrival times of the X-ray photons recorded by a Chandra X-ray detector. You already looked at position information in the previous section when you explored the pixel "value" feature and when you created horizontal and vertical cut graphs. But quantitative analysis generally is not performed on the whole data set. An astronomer might run a program on the whole data set in order to determine likely regions of interest. Then she or he selects one or more interesting features on which to perform more detailed quantitative analysis.

In the Cas-A data we are studying, there are a lot of interesting features. The image looks like an irregular ring of X-ray photons with both brighter and relatively more empty spots inside the ring. One question an astronomer might ask is, which part of the image is brightest, i.e., which pixels have the greatest concentrations of X-ray photons? As you saw in Learning ds9, Part 1, we can review numbers of photons in each pixel by moving the mouse around while looking at the DS9 Value display. But this technique has several drawbacks. You have to remember each piece of data that the table gives you, and calculating any contrasts and comparisons by hand would be very time-consuming.

A quick list of the basic techniques of X-ray analysis:
  • look at an X-ray image using ds9 to get a qualitative feel for the data
  • use ds9 to select one or more regions of interest
  • perform quantitative analysis - spatial, spectral, or timing analysis - on the regions you have selected
In Part 1, we did an exercise that viewed the region around physical X,Y of 4158,4398. That region appears to have fairly large photon values in each nearby pixel. (If you don't remember the results of this exercise, you might want to try it again: click here to return to the directions). To confirm what we saw in our "qualitative" look at that data, we want to analyze the concentrations of photons "quantitatively". We want to compare and contrast the numbers of photons in different regions of the data. We might want, for instance, to know the average number of X-ray photons per pixel in our area of interest compared to other areas in the data set.

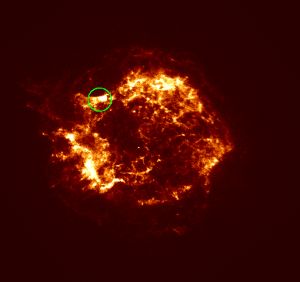
Typically, an astronomer starts quantitative analysis by identifying some regions of interest in which to do his or her analysis. Then she or he will run some programs to produce quantitative results.

Note: If you have just opened this session, make sure that you have started ds9, connected to Virtual Observatory through the Analysis menu, and loaded the Cas-A image. If you are continuing from a previous session, be sure that you have removed any previous contours or other markings on the image, by de-selecting the changes to the image from the analysis menu.

Defining (selecting) Regions of Interest

First, we need to learn how to define regions of interest, known more colloquially to astronomers simply as regions. ds9 provides a very sophisticated capability to define regions which is accessed through the Region menu. However, we will start with the most often used region, a single circle.

The single circle is already defined in ds9 so you can create a circular region directly without use of the Region menu.

Creating a single circular region

Cas A region
Enlarge Image
  • The basic technique is to move the mouse to the place on the image where you want to place the region and press the left mouse button. (Don't drag with the right mouse button depressed or you will change the color and contrast of your image!)
  • For this learning exercise, we will select the region viewed through the value table in Part 1. While watching the physical x,y display, move the mouse near the point where x,y are equal to 4158,4398 and click the left button. You can also do this by looking for the feature in the image itself. Don't worry if you are not exactly on that point.
  • When you click the left button, a green circle is drawn on the screen. Note that since the image can be displayed in many ways, with physical (i.e. actual) pixels binned together, the Physical and Image pixel coordinates may differ. By default, the radius of this circle is 20 physical pixels. This is a region marker and we will use it to perform analysis on the data within that region of the image.


Adjusting position of Region Marker
  • Is the region not exactly where you want it? No problem. Move the mouse into the region and press the left mouse button.
  • While keeping the left button pressed, move the mouse: the region marker will start to move as well. You now can line up the mouse with X,Y of 4158,4398 by watching ds9's X,Y position display.
  • For even more control, click the mouse once inside the region. The region will become selected and will display 4 square handles at its corners. When selected, you can use the arrow keys on your keyboard to fine-tune the region position.
  • When you have placed the region exactly where you want it, click the left button of the mouse in the region to de-select.


Resizing the Region

cas a region 2
Enlarge Image
  • In this exercise, we would like to determine how many X-ray photons are in the bright area right at X,Y 4158,4398 without processing too many of the pixels surrounding it. The default size of the region is a little too large for our needs so we need to decrease the size.
  • Select the region by clicking once inside the region with the left mouse button. The region will become selected and will display four square handles at its corners.
  • Move the mouse over one of the four handles (so that the cursor changes from its usual arrow) and press down the left mouse button.
  • While keeping the left mouse button pressed, resize the region by moving the mouse in or out : see how the size of the circle gets larger and smaller. When you have adjusted the size to include just the bright area at X,Y 4158,4398, release the left mouse button.
  • We are going to use this re-sized region marker in the spatial analysis exercise below. However, we first need to digress to explain more about Region controls. You may want simply to read this section so that the region marker you just defined is preserved. If you make any changes, you will have to recreate it to do the spatial exercise.

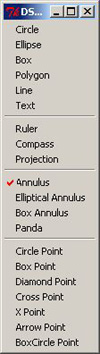
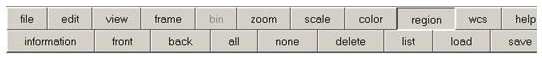
Region Menu & Tool Bar

region bar In the ds9 window you will see a button for "Region" in two areas. The Region button in the top navigation bar controls the Region menu. The Region button in the lower tool bar control short cuts.
  • To use the region menu and access the full range of region options, click on the top bar and use the pulldown menu. For example, Scrolling to the "Shape" menu item will display the choices seen to the left.
  • To use the shortcuts of some more often used options, click on the Regions button in the upper line of the lower tool bar. When you do that, the lower line of the tool bar will display a set of options. To see more options click on the regions button in the lower line and the options will toggle to the second set.

    region tool bar


Regions Delete Function

The regions function remembers the last shape or option that you used. If, for instance, you have made circular annuli, and you click delete all, you will have deleted them from the image, but if you click again on the image, intending to create, for instance, a single circular region, you will instead recreate a default annulus region.

What you must do is use either the top level region pull down menu or the region tool bar to reset your shape choice to "circle". The you can make single circles either by using the top region menu, the lower tool bar, or by clicking directly on the image.

Complex Regions

The information in this section is an advanced lesson for you to experiment with. We suggest that you continue your current session with the quantitativealysis exercises described in the Spatial analysis section which follows. That exercise requires you to use the region of interest you have just defined for the bright area at X,Y 4158,4398. If you do not go to the analysis exercises at this point, you will have to recreate this region. If you come back to the spatial exercise, be sure to check, and if necessary reset your region shape, as described above, before attempting to recreate the single circle region at X,Y 4158,4398.

ds9 allows you to define differently shaped regions interactively, with full control over position, size, rotation, etc. The full set of options for working with regions are found in the Region menu in the top menu bar of the ds9 program.

Cas A Region 3
Enlarge Image
You can make regions of different shapes, including circles, ellipses, boxes, polygons. Generally, astronomers will use either a single circle or annuli, which are multiple concentric circles. Astronomers will sometimes choose a different shape in order to cover an area of interest completely with minimal inclusion of unwanted area. For example, a region might be better covered by a rotated ellipse or a carefully constructed multi-sided polygon. But in general, circles are most often used.

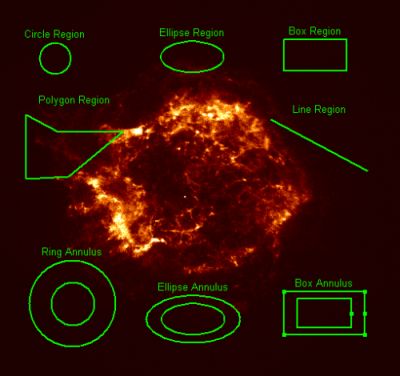
Regions also can be defined to exclude an area from a region of interest, for example, to exclude an elliptical region within a polygon.

To try out advanced region shapes, go to the Region menu in the top menu bar of the ds9 program. The instructions for selecting, deselecting, adjusting position, changing size and deleting are the same as for circles.

Remember to delete any regions you have created before going on to the next section.

Next: Spatial Analysis


Last updated: 08/26/08

bar

Chandra Ed. Home Page | Installation | Learning ds9 | Activities & Images | Evaluation
Learning ds9: Overview | part 1 | part 2 | part 3
Resources: ds9 | Chanda Public Information & Education

Harvard-Smithsonian Center for Astrophysics
60 Garden Street, Cambridge, MA 02138 USA
Phone: 617.496.7941  Fax: 617.495.7356
Comments & Questions?
cxcedu@cfa.harvard.edu

This site was developed with funding from NASA under Contract NAS8-39073.