Education Activities To Accompany Chandra Data Analysis Software Cas A
Activity 4: Make a light curve
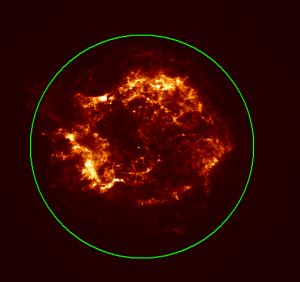
As we shall see when we examine other sources, light curves (which present the brightness of the source as a function of time) can be very exciting and make the objects look like real "clocks in the sky". And indeed, at the time of its explosion, the light curve of Cas A must have been incredibly rich and variable, marking the brightening and subsequent dimming of the central object. The bright, almost circular "ring" that we see in Cas A is the current position of the expanding debris from the explosion. In reality, it is a large hollow shell with very little material in the interior region near the pulsar, since the explosion has swept up the material much like a snowplow does when it drives through snow. Because the material is moving so rapidly, a shock wave forms. We see this as a faint outer shell outside the main ring of ejecta. The jet-like structure visible on the left side of the remnant may indicate higher velocity material rushing outward through a rarified part of the interstellar medium. Let's see how this looks as a function of time. Does the source vary in brightness during the observation?
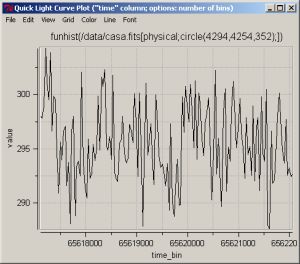
In the analysis drop down menu, select "light curve plot". Place a value of 32.4104 in the upper part of the dialog box, and check both other boxes. Does the intensity versus time appear to be constant? It looks like the intensity is varying wildly! But is this real? Now we come up against one of the most difficult of all scientific problems; deciding whether data is telling us that something unusual is happening to the source, or whether we are just looking at a statistical fluctuation that you would expect to see whenever you examine the object.
Notice that although the light curve seems to change, the value of the intensity is always 295 counts/sec, plus or minus 10 counts/sec. Let's get this replotted so we can get a better idea of the true variation.
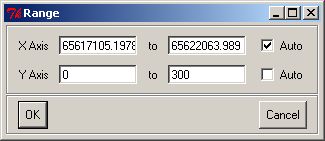
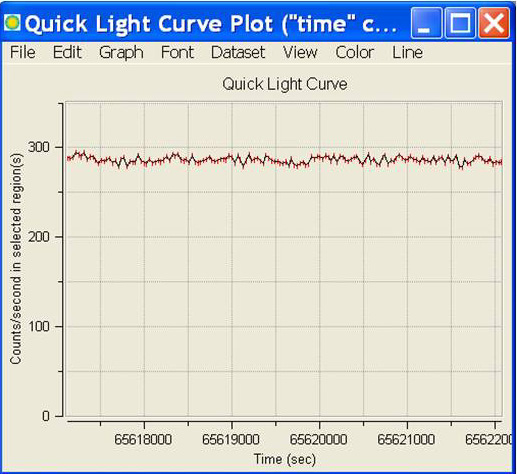
In the light curve plot, select Graph--> axis range... and change the Y axis to read from 0 to 350.; Deselect the auto box. Hit OK. Now look at the same data!!; Quite a bit smoother, isn't it? So what do you believe? Is the source varying in brightness or not? There are sophisticated statistical tests that we make to show that indeed, the light curve does NOT vary in time, at least within the limitations that we have with the Chandra satellite.
Now, make some smaller regions so you can see what happens to the light from little knots of material. Make light curves of these regions. Do they look similar?
Let's examine the background (regions that do not contain the remnant). For example, the region surrounding Physical X=4080 and Physical Y=4600 is within the field of view of Chandra, but is looking at an empty part of space. What does this light curve look like?
Since any instrument has "noise" or a level of signal that occurs even when you are not looking at anything, we can use the above technique to get a truer picture of what the actual source is doing. What you can do in more sophisticated software programs is to take the data from the remnant (which really consists of data PLUS background noise) and subtract off the background component by selecting regions of blank sky.
Note: It is very important that the light curve "tool" have a time bin that is an exact multiple of 3.24104 sec, so we can avoid spurious "aliasing" of the intensity. Try this without this restriction (use, for example, 30 instead of 32.4104 seconds, and see what happens. Can you explain why?)