Education Activities To Accompany Chandra Data Analysis Software Cas A
Activity 5: Radial Intensity profile
To see the actual distribution of the material in the "snowplowed" interstellar region surrounding Cas A, we can look at the intensity of X-rays coming from concentric rings of material, projected onto the sky.
1. Select an annulus for your region shape, and center the cursor over the pulsar. Click once to create the region, and again to select it.
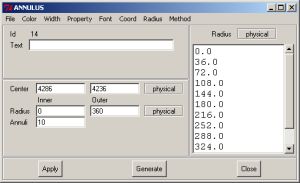
2. Go to the Region-->Get info... dialog box and enter an inner radius of "0" and an outer radius of 360, with 10 for the number of annuli. (Note: you MUST select the region by clicking once anywhere inside it before you go to the "get info" dialog box).
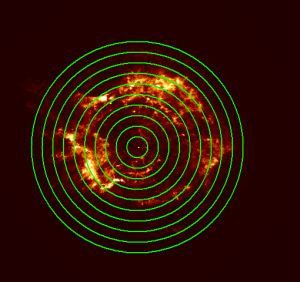
3. Click on "generate" and then "apply". You will notice that 10 concentric rings appear like a bulls-eye surrounding the remnant. What we will find out is how bright the remnant is as a function of how far you are away from the center.
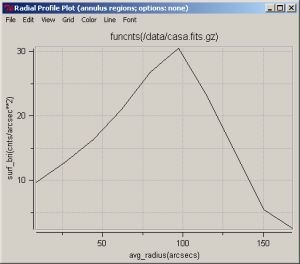
Your result shows you that the intensity of the remnant steadily increases from the center until about 100 arc-seconds in radius. Thereafter, the remnant gets weaker and weaker. This is what you might expect for a more or less hollow ball, with a dense outer shell. In fact, the exact nature of this emission and its morphology (or shape), is a subject of intense research currently. By looking at profiles like these, astronomers hope to gain some insight into the nature of the original explosion, and better understand the mechanisms by which the shock fronts form and travel through space.