Education Activities To Accompany Chandra Data Analysis Software Cas A
Activity 6: Make energy spectra
The best, however, is yet to come. Some of the most exciting data from this object concerns the energy spectrum of the X-ray "light" from different parts of the remnant. Just as a blue flame is hotter than a red flame, and sodium vapor lights are yellow while mercury lights are blue, X-rays can tell us about the state of emitting regions and what substances are present in each part of the object. And when we look at the energy of all the X-ray photons that Chandra can collect from Cas A, a remarkable picture emerges.
Superimposed on a continuous background of X-ray light, we detect the "fingerprints" of the elements. Like a prism that takes sunlight and makes a "rainbow" out of what we think is only yellow light, so the detectors on Chandra examine X-rays. And just as that "rainbow" contains information about the chemical composition of the Sun, so the Chandra energy spectrum tells us about the recycled material from our supernova. It's all there, the building blocks of life: Calcium, oxygen, iron.... (See Summary for a composite output picture)
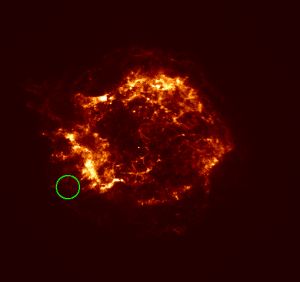
Set up a circular region near Physical X,Y (4050,4100). (Note: the exact position is not crucial, but try to get near this area). This will put a region near the bottom left part of the remnant. From the Analysis menu, do an energy spectrum from .1-10 kev. This is spectrum (a).
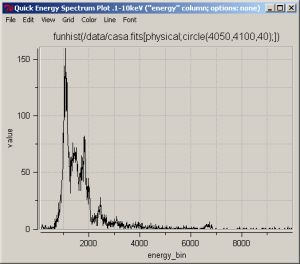
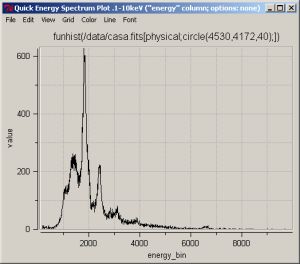
Note how different the spectra are! The (a) spectrum has enormously enhanced features at 1 kev as compared to that of (b). (This will show up as a spike near the value of 1000 for energy_bin on the graph of the "a" region). This is a line of IRON. What we are seeing is probably different parts of the interior of the exploded star, which had layers like an onion, with different abundances of different elements, depending on the distance from the center. So an iron rich layer is currently at the position of region (a), and an iron poor layer is at (b). Thus, the remnant is a direct link to the deep interior of the now exploded star. Supernova remnants therefore provide quite important clues concerning the evolution of stars in our universe.