There are other ways to adjust the image. Try this:
move the mouse to the top of the ds9 window, over the word "color"
press the left button to display the color menu options
while pressing the left button, move the mouse down until you reach an option that you want to apply to the image
let go of the left mouse button to select that color option
Now once again move your mouse into the image, press the right mouse button, and move the mouse around. See how the colors change, once again bringing out different features. You are using the contrast & bias adjustment with color. Try some other color menu choices until you find a color scheme that you like.
In ds9, the selected color map is displayed graphically in a "one-dimensional" sliding image below the main display window. The left side of the bar shows you the color assigned to the low intensity pixels, and as you go towards the right, you see the colors assigned to progressively higher intensity pixel values.
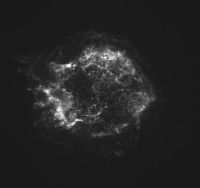
grey
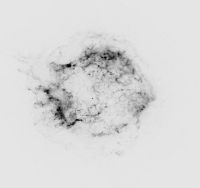
inverted grey
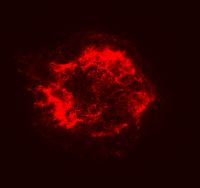
red
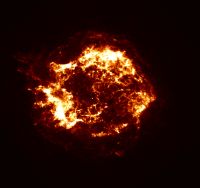
bb
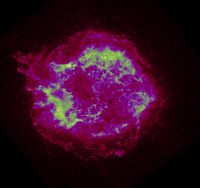
he
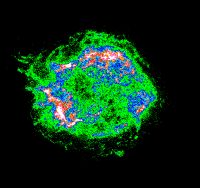
i8
More on Color Maps
Colors are specified by the voltages applied to the red,
blue, and green color generators in the monitor of your computer screen. The assignment of actual colors to intensity levels is accomplished through the use of pseudo-color Color Maps. In such maps, any color can be assigned to any intensity level. Color maps are designed to highlight differences among the pixel values. Depending on the levels which best distinguish the detail one wishes to study, the shifts from blue to red and red to yellow can be placed at higher or lower image pixel values and closer together or farther apart. The changes in color can be made gradual or sharp.
DS9 implements color maps by specifying colors at a few intensity, and interpolating to assign colors at intermediate levels. For example, the basic grey-scale color map specifies no intensity for any color at the lowest pixel values (black), full intensity for all colors at the highest values (white), with the red, green and blue intensities varying linearly for intermediate levels. DS9 offers a number of popular pseudo-color maps as well as a basic grey-scale map.