 |  | |||||
| Learning ds9: Overview | Part 1 | Part 2 | Part 3 | [Contact Help] [Chandra Public Page] |
| |||||||||
| |||||||||
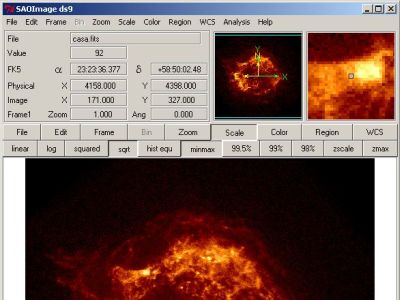
Learning to Use the ds9 Imaging SystemPart 1: First Look Qualitative Analysis using ds9A quick list of the basic techniques of X-ray analysis:Counting Photons Recall that an incoming X-ray photon is focused by the X-ray telescope and then hits the X-ray detector that is currently in the focal plane of the telescope. This can be the HRC or ACIS (with some gratings options thrown in for good measure). The X-ray detector then records information about that X-ray photon for eventual transmission back to earth. If the detector is the HRC, an accurate position and arrival time are recorded. If it is the ACIS, an accurate position and energy are recorded, along with some timing information. To record an accurate position, both detectors act like a super-fine mesh or grid, recording the grid element (or "pixel") that the X-ray strikes. As more and more X-rays strike the detector grid, each pixel in the grid can be hit by zero, one, or more X-rays. When we display this initial image of Cas-A, what we are displaying is the number of X-rays that were recorded to hit each pixel during a given observation. Try this:
Next: Looking at an X-ray image: Image Manipulation & Pixel "Value" Last updated: 05/11/05 |
|
Chandra Ed. Home Page | Installation | Learning ds9 | Activities & Images | Evaluation Learning ds9: Overview | part 1 | part 2 | part 3 Resources: ds9 | Chanda Public Information & Education |
|
|
Harvard-Smithsonian Center for Astrophysics 60 Garden Street, Cambridge, MA 02138 USA Phone: 617.496.7941 Fax: 617.495.7356 |
Comments & Questions? cxcedu@cfa.harvard.edu |
|
This site was developed with funding from NASA under Contract NAS8-39073. | |